GBP/USD Price Analysis: Sellers attack seven-week-old support line around 1.3250
- GBP/USD fails to respect Friday’s Doji candlestick amid Brexit woes.
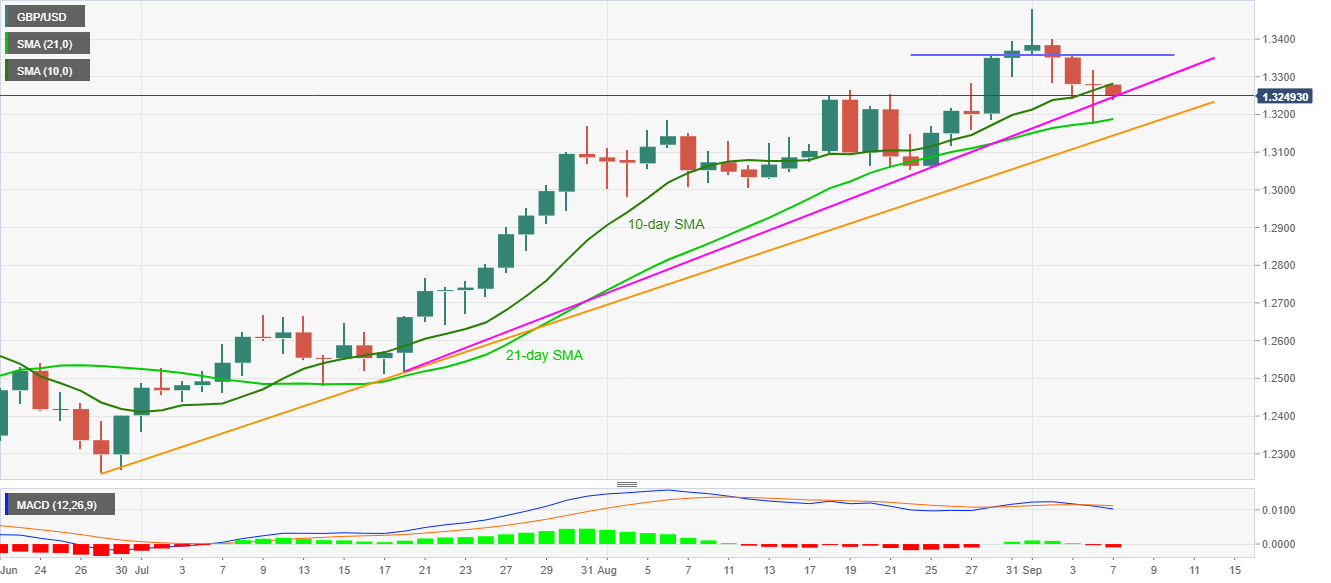
- 21-day SMA, ascending trend line from June 29 add to the downside filters, bearish MACD favor sellers.
- 10-day SMA guards immediate upside ahead of 1.3360 and 1.3400 resistances.
GBP/USD remains on the back foot while declining to 1.3248, down 0.23% on a day, during the early Monday’s trading. In doing so, the Cable disrespects Friday’s Doji candle, suggesting a reversal of the previous bearish move, amid increasing odds of a no-deal Brexit.
Read:
The quote currently trades near a short-term support line, at 1.3245 now, backed by the bearish MACD signals.
However, 21-day SMA and a two-month-old rising trend line, respectively around 1.3185 and 1.3140 can question the sellers afterward.
Alternatively, a daily closing beyond the 10-day SMA level of 1.3282 will confront a short-term horizontal resistance around 1.3360.
In a case where the bulls manage to cross 1.3360, 1.3400 round-figures and the recently flashed multi-week high around 1.3480/85 will be in the spotlight.
GBP/USD daily chart
Trend: Bearish