EUR/USD may find a bottom but has limited room to run higher – Confluence Detector
EUR/USD has been on the back foot following upbeat US data. How low can it go? The bottom may be near.
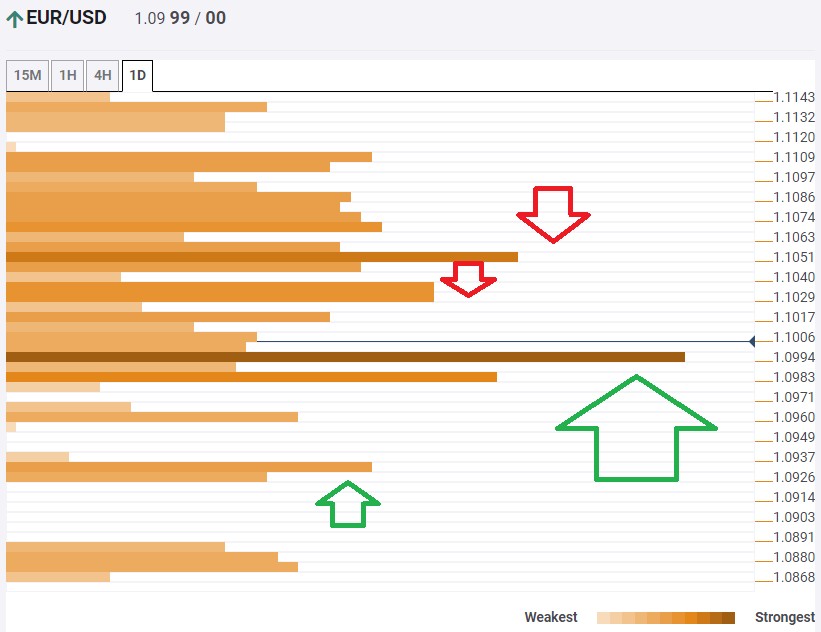
The Technical Confluences Indicator is showing that EUR/USD has support at 1.0994, which is the convergence of the Bollinger Band 4h-Lower, the previous monthly low, the Pivot Point one-day Support 1, the Bollinger Band one-day Lower, and more.
Further down, the downside target is 1.0926, which is the meeting point of the PP one-day Support 3, the PP one-week S3, and the Fibonacci 161.8% one-week.
Looking up, some resistance awaits at 1.1029, which is the confluence of the PP one-week Support 1 and the Fibonacci 61.8% one-day.
The next hurdle is close. At 1.1051, the Fibonacci 23.6% one-month and the previous day's high converge.
All in all, the path of least resistance is to the upside, but its range is limited.
Here is how it looks on the tool:
Confluence Detector
The Confluence Detector finds exciting opportunities using Technical Confluences. The TC is a tool to locate and point out those price levels where there is a congestion of indicators, moving averages, Fibonacci levels, Pivot Points, etc. Knowing where these congestion points are located is very useful for the trader, and can be used as a basis for different strategies.
This tool assigns a certain amount of “weight” to each indicator, and this “weight” can influence adjacents price levels. These weightings mean that one price level without any indicator or moving average but under the influence of two “strongly weighted” levels accumulate more resistance than their neighbors. In these cases, the tool signals resistance in apparently empty areas.
Learn more about Technical Confluence