Back
3 Feb 2020
US Dollar Index Price Analysis: DXY recovers, trading back near 97.85 level
- DXY pared almost all the losses which happened last Friday.
- Targets on the way up remain near 98.20 and 98.50 levels.
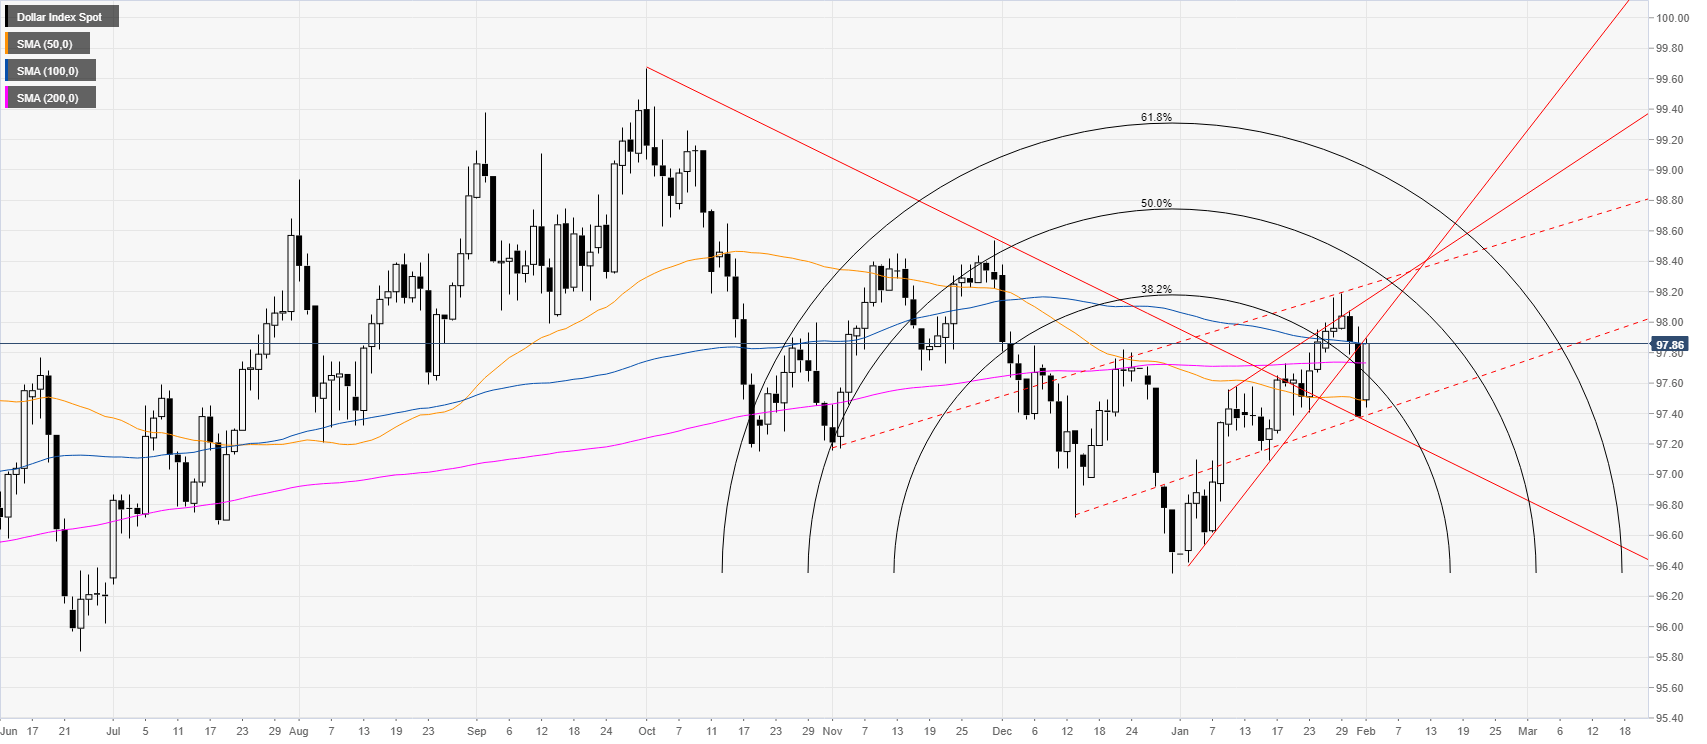
DXY daily chart
The US dollar index (DXY) is recovering from last Friday’s drop. The market is trading back above the 200-day simple moving average (SMA) while challenging the 100 SMA. DXY is also holding above the 38.2% retracement from the Fibonacci arc.
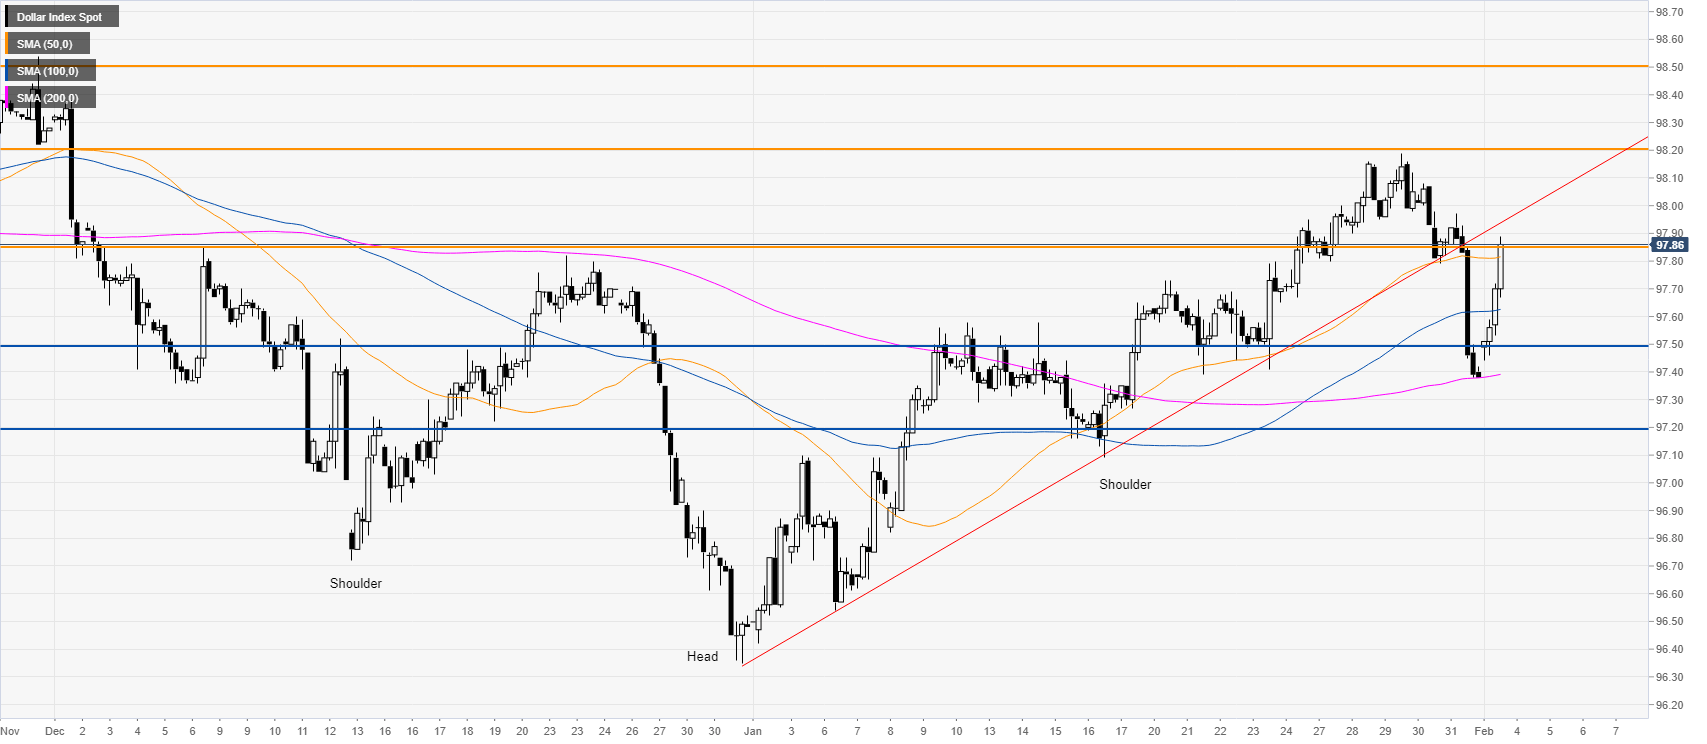
DXY four-hour chart
DXY is recovering sharply after the recent drop. The bulls are challenging the 97.85 resistance while above the main SMAs on the four-hour chart. As the market is still trading off the inverted head-and-shoulders pattern, the bulls are still looking to break above the 98.20 level to reach the 98.50 resistance. Support is seen at 97.50 and 97.20 price levels.
Additional key levels