Back
20 Jan 2020
AUD/USD Price Analysis: Aussie sliding down below the 0.6900 figure
- AUD/USD is under selling pressure in the New York session.
- The level to beat for bears is the 0.6854/35 support zone.
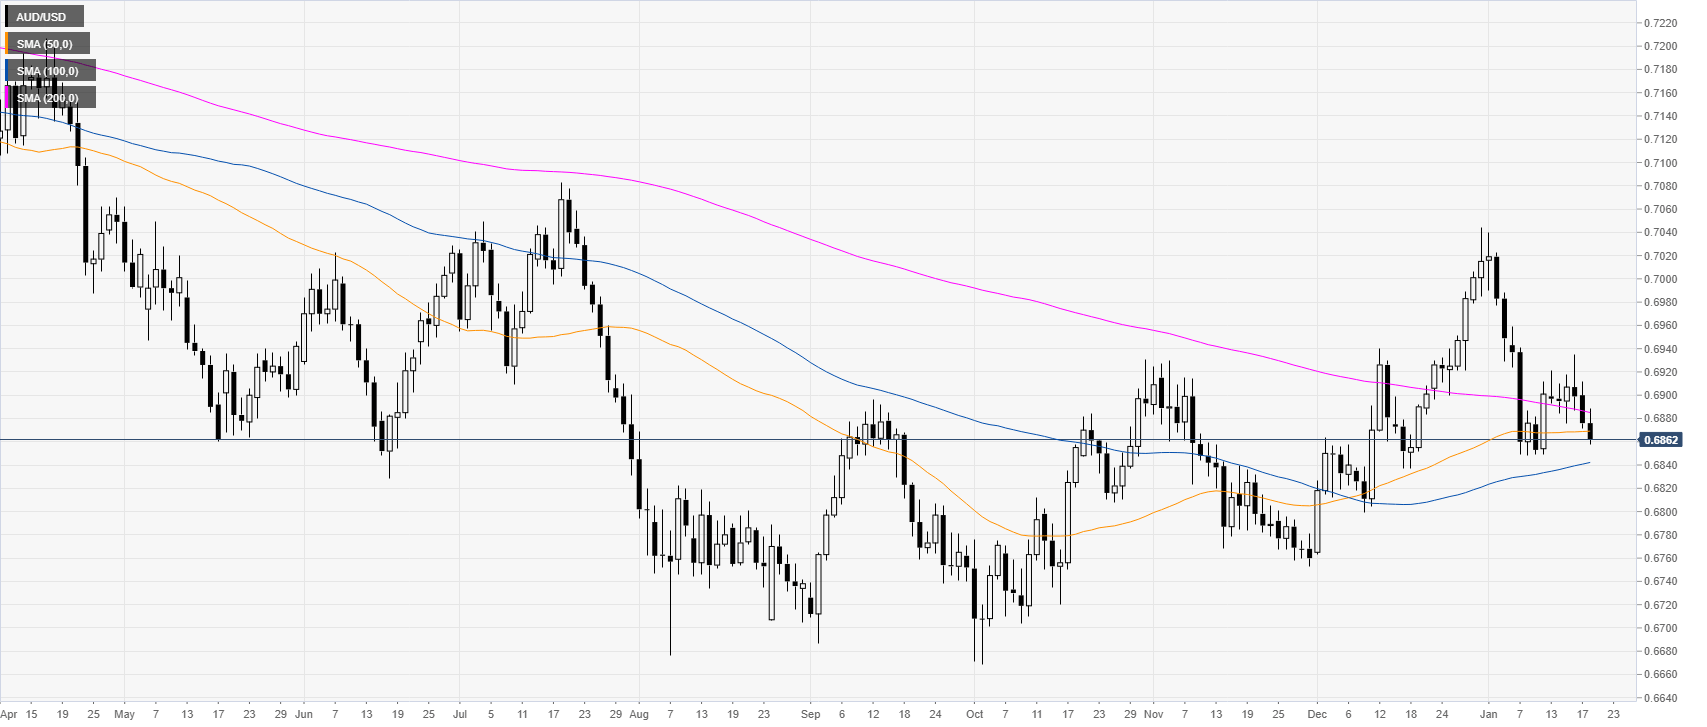
USD/CAD daily chart
AUD/USD is nearing the monthly lows while trading below the 50/200-day simple moving averages (SMAs), suggesting an overall bearish momentum.
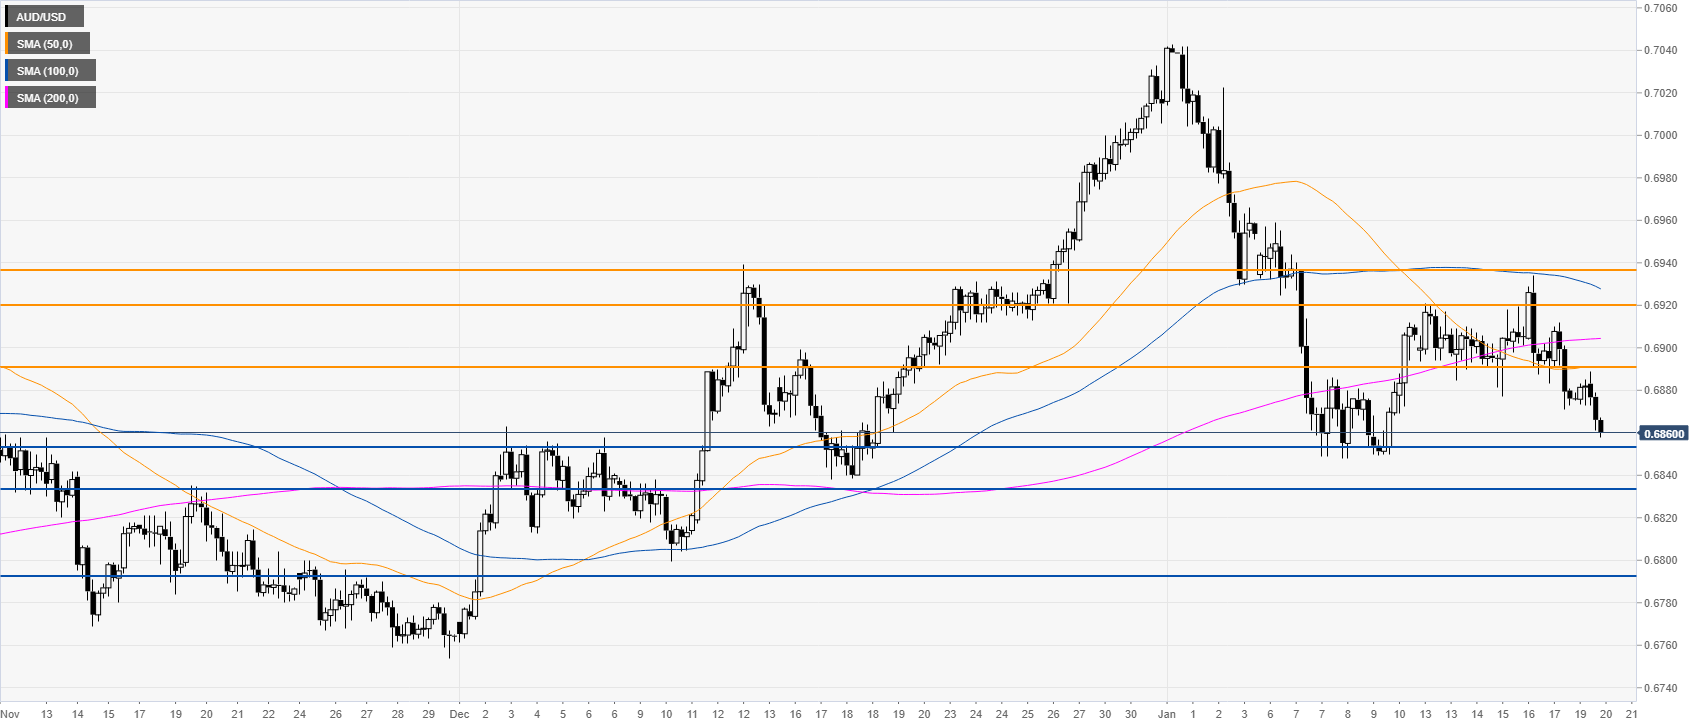
USD/CAD four-hour chart
AUD/USD is under bearish pressure below the main SMAs and the 0.6900 figure. Bears are trying to drag the market below the 0.6854/35 support zone. A daily close below this level can lead to further weakness towards the 0.6792 level, according to the Technical Confluences Indicator. Resistance is seen at the 0.6892, 0.6920 and 0.6937 level.
Additional key levels